
Insulin Resistance: The Biggest Silent Threat to Longevity
- Dr. Crishna Kumar
- Oct 31, 2025
- 9 min read
Updated: Apr 11
You go for your yearly check-up, tick off the usual tests, and walk out thinking you’re in the clear. But what if one of the most significant risk factors wasn’t even on your results slip?
Most people worry about their weight, blood pressure, or cholesterol. Whilst these are important, there’s an even bigger health risk that millions live with every day without even knowing it. It’s called insulin resistance, and chances are you’ve never been tested for it.
What is Insulin Resistance?
Insulin resistance is a condition where your body becomes less responsive to insulin. Insulin is a hormone made by the pancreas that helps move glucose (sugar) from the bloodstream into the cells for energy or storage.
When your body is functioning normally, glucose levels rise after eating. The pancreas - sensing the glucose in the blood - releases insulin, which acts like a key, unlocking the gates so glucose can enter the cells. Blood glucose levels return to normal once glucose is taken up by the cells.
In insulin resistance, this process is malfunctioning. Muscle, fat and liver cells in particular are not responding to these signals to unlock the gates. The pancreas detects the glucose remaining in the blood and in response compensates by releasing more insulin to bring the glucose levels down. Over time, this leads to chronically high insulin levels, known as hyperinsulinaemia[1].
Why Insulin Resistance is Dangerous
Hyperinsulinaemia alone causes health problems through a wide variety of mechanisms:
Fat accumulation: Persistently high insulin increases fat storage and reduces fat breakdown. This leads to obesity and fat accumulation around abdominal organs (visceral fat)[2].
Inflammation: Fat cells release of inflammatory molecules, which worsens insulin resistance and causes oxidative stress and DNA damage. Oxidative stress is where harmful molecules called free radicals build up in the body and overwhelm your natural defences, leading to cell and tissue damage [3].
Blood vessel dysfunction: Insulin resistance disrupts nitric oxide production, which is responsible for widening the blood vessels, thereby promoting high blood pressure. Additionally, it increases vascular smooth muscle proliferation and blood vessel inflammation, both of which are important processes in atherosclerosis - the formation fatty plaques that narrow arteries to the heart and brain[4].
Cancer: Insulin stimulates insulin-like growth factor 1 (IGF-1), which signals cells to grow and divide more than normal. Along with inflammation, these mechanisms create an environment where cancer cells can thrive[5].
Health Risks of Insulin Resistance
These processes contribute to the development of a large number of conditions across several different body systems, including at least 13 types of cancer[6,7]:

Insulin Resistance vs Other Risk Factors
Many of you know that high blood pressure, high LDL (”bad”) cholesterol and smoking are risk factors for heart disease. But how does insulin resistance compare to these other markers when we talk about risk to your health?
An analysis of over 28,000 women in the Women’s Health Study measured more than 50 clinical and biomarker risk factors to see which ones were most strongly associated with developing coronary artery disease. One of the standout findings was that Lipoprotein Insulin Resistance Index (LP-IR), a biomarker of insulin resistance, was amongst the strongest predictors for heart disease before age 55[8].
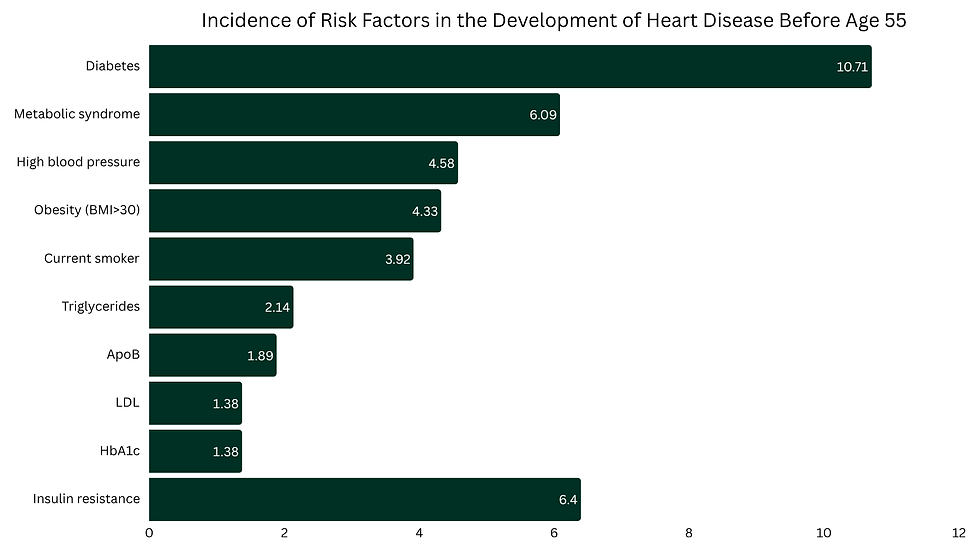
This study suggests that insulin resistance is a stronger predictor of early cardiovascular disease than traditional markers, such as HbA1c, LDL and apolipoprotein B (ApoB), and may be one of the best early warning signals we have for heart disease.
Although this study looked only at women, research has shown that other measures of insulin resistance - like the Triglyceride-Glucose (TyG) Index and HOMA-IR - are also strong predictors of heart disease in men[9,10].
You Might Have Insulin Resistance and Not Even Know It
The problem with most blood tests assessing glucose metabolism is they become abnormal once metabolic dysfunction has already progressed to prediabetes or diabetes - not early when insulin sensitivity is already impaired. Insulin resistance usually appears 1-2 decades before type 2 diabetes is diagnosed[10].
During the early stages, the pancreas compensates by producing more insulin to maintain blood glucose within a normal range. Even if blood sugar appears normal, the body is being damaged by chronic exposure to hyperinsulinaemia and insulin resistance. That is why fasting blood glucose, HbA1c and even continuous glucose monitoring (CGM) monitoring all look normal, lulling you into a false sense of security. Fasting insulin similarly cannot be relied upon as it can fluctuate day to day, varies between people, and is affected by stress, sleep and diet - so a single number doesn’t tell the full story.

Not carrying excess body fat does not mean you are immune from insulin resistance - it can occur in those of normal body weight. It is estimated that just over 30% of normal weight individuals may have underlying metabolic dysfunction[12].
Why Traditional Measures of Glucose-Insulin Regulation Fall Short
Most measures they don't directly measure insulin resistance. The body can compensate to keep glucose levels stable despite insulin resistance being present. Instead these test detect problems after insulin resistance has already been present for decades.
HbA1c (Glycated Haemoglobin)
Measures the percentage of haemoglobin in red blood cells that have glucose attached to it. This correlates roughly to the average blood glucose levels over the past 3 months. Glucose attaches to the haemoglobin in red blood cells when blood sugar is elevated, and becomes glycated. The longer blood glucose remains elevated, the more glucose binds to haemoglobin, and higher the HbA1c.
HbA1c however can be falsely elevated or falsely reduced in various states. Conditions that reduce red blood cell lifespan or increase its turnover result in can falsely lower the HbA1c, as there is shorter exposure to glucose. Common conditions include blood loss, haemolytic anaemia, pregnancy, recent blood transfusion and end-stage renal failure. Conversely, conditions which extend red blood cells lifespan or reduce its turnover result in falsely higher Hba1c, as there is longer exposure to glucose. Common conditions include iron, B12 or folate deficiency, chronic alcohol consumption and asplenia.
HbA1c is useful for diagnosing diabetes, monitoring blood sugar control in diabetics and assessing the risks of diabetes complications.
Typical interpretation of HbA1c:
Normal: ≤5.6% (38 mmol/mol)
Pre-diabetes: 5.7-6.4% (39-46 mmol/mol)
Diabetes: ≥6.5% (48 mmol/mol)
Fasting BGL (Blood Glucose Level)
Measures blood sugar after an overnight fast. In those with normal metabolic functioning, your blood sugar should be low after not eating during the entire time you are asleep.
However even with good metabolic health, your fasting blood glucose level can be elevated. This is called the dawn phenomenon. This effect is caused by normal circadian hormones (cortisol, glucagon, adrenaline) released near waking to prepare the body to wake up. This can be confirmed by assessing other metabolic markers (eg. ApoB, triglycerides, obesity) and/or CGM showing stable overnight glucose.
Typical interpretation of fasting BGL:
Normal: ≤5.5 mmol/L (99 mg/dL)
Prediabetes: 5.6-6.9 mmol/L (100-124 mg/dL)
Diabetes: ≥7.0 mmol/L (126 mg/dL)
Fasting Insulin
Measures the amount of insulin circulating in the blood after fasting. With insulin resistance forcing the body to produce more insulin, elevated fasting insulin can suggest the body is struggling to control glucose levels.
However it cannot be relied on solely as a measure of insulin resistance as it has a few limitations:
Fasting insulin levels can be highly variable, as they are easily affected by recent changes in stress, sleep, diet and exercise
Insulin resistance becomes more apparent after meals, which fasting insulin does not capture
Individual pathology labs use different methods to measure insulin levels, resulting in different reference ranges, making it hard to compare results
OGTT (Oral Glucose Tolerance Test)
Measures the body's response after ingesting a large glucose load. The usual protocol involves measuring fasting glucose levels, then drinking a 75g glucose solution, with blood glucose measured again at 2 hours.
Physiologically, OGTT is a complex test as it reflects the combined effect of several systems:
Insulin secretion from the pancreas
Insulin sensitivity in muscle
Liver glucose production
Gut hormone (incretin) responses
Glucose absorption
With so many processes influencing the result, the test cannot isolate insulin resistance alone.
1-hour glucose OGTT is a better version of the traditional 2-hour OGTT as it captures the early insulin response. The first phase insulin response is the rapid burst of insulin the pancreas releases when glucose rises after eating. In early stages of insulin resistance, this response become impaired first, with the 1-hour glucose level rising before fasting or 2-hour glucose does.
All OGTT measurements suffer from the similar limitations:
The test is time consuming, taking 2-3 hours to complete, and drinking 75g of glucose at once is often unpleasant for patients
Results can vary between tests due to recent sleep, stress, diet and exercise
Whilst these biomarkers are useful to monitor, there are more accurate and early measures of insulin resistance available to us.
Better Measures of Insulin Resistance
Triglyceride-Glucose (TyG) Index
Calculated score measuring insulin resistance using fasting triglycerides and fasting glucose. It uses triglycerides, which is a marker of systemic and muscle insulin resistance. Insulin normally suppresses fat breakdown in fat tissue. In insulin resistance, this process is impaired causing more fat to be broken down and free fatty acids (FFAs) released into the blood. These FFAs are then converted to triglycerides in the liver and released into circulation (packaged in VLDL particles).
TyG index has been shown to predict insulin resistance better than HOMA-IR and HbA1c. In addition to insulin resistance, elevated TyG index has been associated with future risk of death (all-cause mortality), heart disease, type 2 diabetes, fatty liver, dementia and multiple types of cancer.
Strengths of TyG index:
Uses two commonly tested markers, making it simple and easily accessible
Absence of insulin makes the result less influenced by pancreatic beta-cell function and fluctations of fasting insulin
Captures systemic metabolic dysfunction by assessing the two systems of glucose metabolism and lipid metabolism
Limitations of TyG index:
High triglycerides from other causes can overestimate insulin resistance - eg. excessive alcohol use, genetic hypertriglyceridaemia
More research is required to determine cut-offs for different populations
Typical interpretation:
Insulin resistance: >4.5
Normal insulin sensitivity: <4.5
You can calculate your TyG Index here.
HOMA-IR (Homeostatic Model Assessment of Insulin Resistance)
HOMA-IR is calculated score using fasting glucose and fasting insulin levels. It reflects liver insulin resistance, based on how well insulin suppresses glucose production in the liver.
It is a more accurate measure of insulin resistance than traditional biomarkers of metabolic health. Higher HOMA-IR is associated with prediabetes, non-alcoholic fatty liver disease (NAFLD), cardiovascular disease risk and metabolic syndrome.
Limitations of HOMA-IR:
Only reflects fasting state, not insulin sensitivity after eating. Insulin resistance can differ between tissues, and different tissues are more insulin sensitive during fasting or after meals. Liver insulin resistance is more prominent during fasting, which HOMA-IR will mainly reflect. Muscle insulin resistance is more evident after meals, which HOMA-IR does not capture as well. Someone might have normal fasting glucose, but have high post-meal glucose spikes due to muscle insulin resistance.
Influenced by pancreatic beta-cell function. If beta-cells are failing (as seen in later stage prediabetes or diabetes - refer to Stages of Insulin Resistance graph above), they cannot produce enough insulin to compensate for insulin resistance. Low insulin from beta-cell failure will result in a normal or low HOMA-IR, even though the person is very insulin resistant.
Same limitations of using fasting insulin discussed above - insulin levels are sensitive to other changes and different assays used between labs
Typical interpretation:
Normal insulin sensitivity: ≤1.9
Insulin resistance: ≥2.0
Taking The Fight To Insulin Resistance
What can you do to treat or prevent insulin resistance?
Fortunately, we now have more accurate tests to detect insulin resistance long before blood glucose or HbA1c start to rise - including LP-IR, TyG Index and HOMA-IR.
The good news? Insulin resistance is highly reversible when caught early and treated with the right interventions.
In my next articles, we’ll be taking a deep dive into how to test for insulin resistance, and the most effective, evidence-based ways to prevent and reverse insulin resistance - so you can take control of your health.
The information provided in this blog is for educational and general informational purposes only and is not intended as a substitute for professional medical advice, diagnosis, or treatment. No doctor/patient relationship is formed. Always seek the advice of your medical practitioner or another qualified healthcare provider with any questions you may have regarding your health or medical condition. Never disregard professional medical advice or delay in seeking it because of something you have read on this blog. Reliance on any information provided here is solely at your own risk.
References
Lee SH, et al. Insulin Resistance: From Mechanisms to Therapeutic Strategies. Diabetes Metab J. 2022;46(1):15-37
Hardy OT, et al. What causes the insulin resistance underlying obesity?. Curr Opin Endocrinol Diabetes Obes. 2012;19(2):81-87
Bkaily G, et al. Pathophysiology of Prediabetes Hyperinsulinemia and Insulin Resistance in the Cardiovascular System. Biomedicines. 2025; 13(8):1842
Muniyappa R, et al. Role of insulin resistance in endothelial dysfunction. Rev Endocr Metab Disord. 2013;14(1):5-12
Zhang AMY, et al. Hyperinsulinemia in Obesity, Inflammation, and Cancer. Diabetes Metab J. 2021;45(3):285-311
Ullah MI, et al. Obesity: Clinical Impact, Pathophysiology, Complications, and Modern Innovations in Therapeutic Strategies. Medicines. 2025;12(3):19
Szablewski L. Insulin Resistance: The Increased Risk of Cancers. Curr Oncol. 2024;31(2):998-1027.
Dugani SB, et al. Association of Lipid, Inflammatory, and Metabolic Biomarkers With Age at Onset for Incident Coronary Heart Disease in Women. JAMA Cardiol. 2021;6(4):437-447
Tian X, et al. Association of lipid, inflammatory, and metabolic biomarkers with age at onset for incident cardiovascular disease. BMC Med. 2022;20(1):383
Gast KB, et al. Insulin resistance and risk of incident cardiovascular events in adults without diabetes: meta-analysis. PLoS One. 2012;7(12):e52036
Martín-Timón I, et al. Type 2 diabetes and cardiovascular disease: Have all risk factors the same strength?. World J Diabetes. 2014;5(4):444-470.
Wang B, et al. Prevalence of Metabolically Healthy Obese and Metabolically Obese but Normal Weight in Adults Worldwide: A Meta-Analysis. Horm Metab Res. 2015;47(11):839-845
